Artificial Intelligence
Utilize Data, Optimize Process, Amplify Business
Utilize Data, Optimize Process, Amplify Business
As industries rapidly embrace Digital Transformations, the amount of data generated is also growing exponentially. This huge amount of data contains possibilities to improve the industry itself. With the right refinement process, data could be turned into insights, creating endless possibilities of improvement and optimization into your business needs and goals.

Analytics as
a Service

Artificial Intelligence
as a Service

Machine Learning Operations (MLOps)

Use Case
Example
Analytics as a Service

Data is the result of direct observation of an event or situation that has no actionable output . Then, information is a collection of data/facts that are organized or processed in a certain way. Knowledge is information that has been evaluated, compiled, or managed to be applied in supporting decisions. Insight is the ability to result from knowledge to gain a deep understanding of a problem
Our Services for Analytics as a Service

- Understand how to use data and analytics for achieving Business goals.
- Planning the Analytical Development, from Diagnosis, Specification, Tactical Plan, Return on Investment & Risk
- Identify key factors for Business metrics and goals
- Build Analytics Product based on the metrics and goals & Deploy, Implement, and evaluate AI Model into production
Define the Company’s Analytics needs.
Recruit, train, coach, and held workshops
for employees and stakeholders.
Why Choose Us for Analytics as a Service
We provide End to End Data and Analytics solutions for your disposal. We understand that everybody has their own “Data Journey” and we will be your friend in The Journey. We also care not only about giving the best solutions for your business needs, but more than anything, we strive to forge healthy and prosperous strategic partnerships with you
Artificial Intelligence as a Service
AI development is the process of developing a company-specific AI solution targeting a particular problem. Since custom AI software (solution) is developed for a single business it needs to satisfy the business’ specifications and expectations. On the other hand, out-of-the-box (OOTB) AI software is a packaged solution sold by vendors to satisfy the needs of numerous organizations. AI Consulting Services help companies use AI technologies to improve businesses. We can help clients formulate an AI strategy, identify AI use cases and implement AI/ML solutions and provide training to your employees.
Our Approach to
Artificial Intelligence as a Service
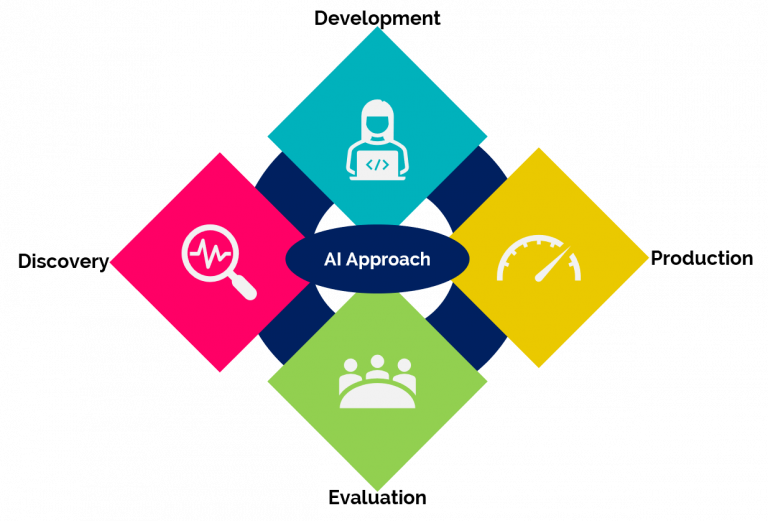
We evaluate the potential of your existing data, software infrastructure, and technology to deploy AI systems and workflows. We discover the best AI technology and tools not only to answer your Business goals but also optimize your Business potentials
Our AI consulting team reviews the existing workflow, processes, and operations to determine if an AI solution can bring efficiency. We do quick PoC and mockups to gather feedback from the stakeholders. Once the stakeholders can see the value, then we collect requirements and prepare a roadmap for your project that outlines the project timeline estimate, cost to build an AI app, and deliverables.
We provide a small-scale system/MVP to demonstrate the capability of AI technology for your business and analyze the possible improvement to the AI system.
Once all stakeholders see the value and approve the proposed solution, our AI developers and designers launch a live system. We also maintain and provide support for ongoing operations and changes
MLOps
MLOps is fundamental. Machine Learning helps individuals and businesses deploy solutions that unlock previously untapped sources of revenue, save time, and reduce cost by creating more efficient workflows, leveraging data analytics for decision-making, and improving customer experience. These goals are hard to accomplish without a solid framework to follow. Automating model development and deployment with MLOps means faster go-to-market times and lower operational costs. It helps managers and developers be more agile and strategic in their decisions.
MLOps Diagram
ML models always demand data transformation in some form, they can be difficult to run and manage reliably. Using proper data pipelines offers many benefits in machine learning operations management, run time visibility, code reuse, and scalability. ML is itself a form of data transformation, so by including steps specific to ML in the data pipeline, it becomes an ML pipeline. From specific data instances, the ML pipeline enables tracking versions in source control and automating deployment via a regular CI/CD pipeline. This allows for the automated, structured connection of data planes and code.
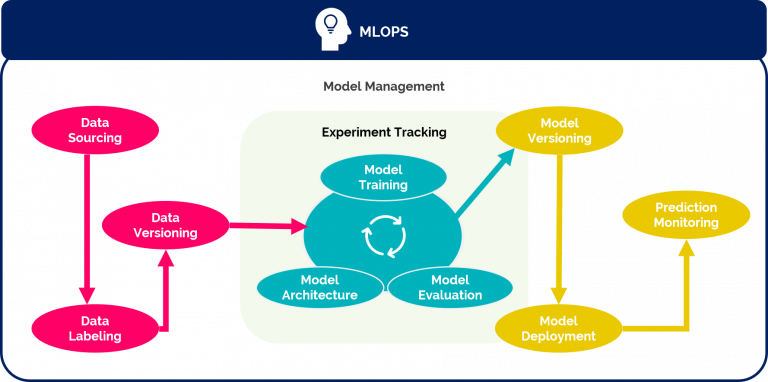
Design, Develop, Monetize
MLOps intend to automate as much as possible, eliminate waste, and produce deeper, more consistent insights using machine learning. When you develop your use-case for MLOps, it can help to visualize the stack of technology needed to make the process happen. Components like feature store, model registry, data analysis, and ML pipeline should all be considered.
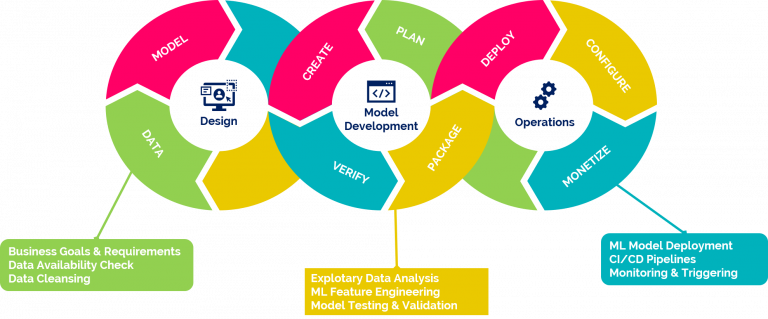
MLOps Amplify Business Values
Machine Learning grows with ML research applied to business solutions. MLOps helps deploy ML models within minutes rather than weeks and enables them to achieve a far faster value result than with homegrown deployments
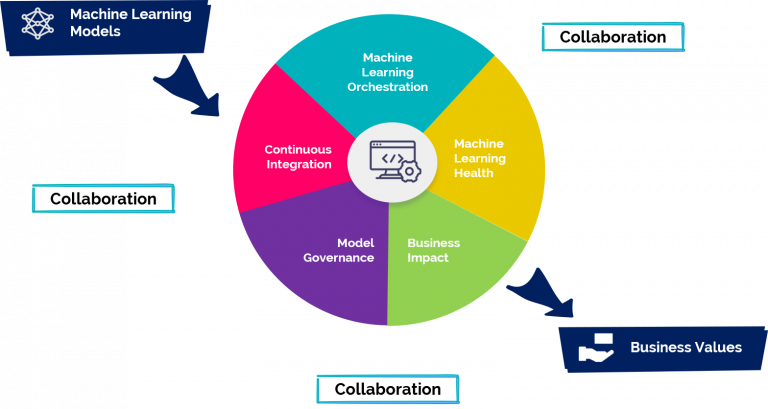
MLOps Workflow
Enforces Best Practices
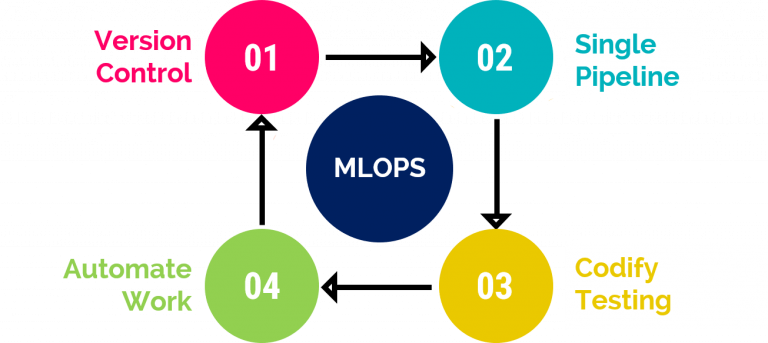
Version control everything, including models, code, data, parameters, and environment. Enable anyone to trace how a model was produced.
Componentize the steps of the model creation process and build them into a pipeline. A single notebook is not a pipeline.
Codify testing. With checkpoints and safeguards in place, there is a standard that models have to adhere to.
Automate work to increase how much time can be spent on future development.
Use Case Example
Background
Data monetization is the process of using data to increase revenue.
Why data monetization is essential for your organization ?
- Optimizes use of data.
- Extracts more, and better insights for you, your customers, and partners
- Streamlines decision-making & planning
- Increases operational productivity and efficiency
- Improves understanding of customers and customer experience
Methods
How well do you truly know your customers?
Truly knowing your customers is about more than identity. It’s also about preferences, needs and the contextual knowledge of time and place. In the digital world, customers expect to be known as individuals with distinct preferences, not just as one member of a segment. Knowing your customer is powered 10 percent by your internal data and 90 percent by your ability to model the behavior of your customer
“KYC” refers to the steps taken by a financial institution (or business) to:
- Establish customer identity
- Understand the nature of the customer’s activities (primary goal is to satisfy that the source of the customer’s funds is legitimate)
- Assess money laundering risks associated with that customer for purposes of monitoring the customer’s activities
Results
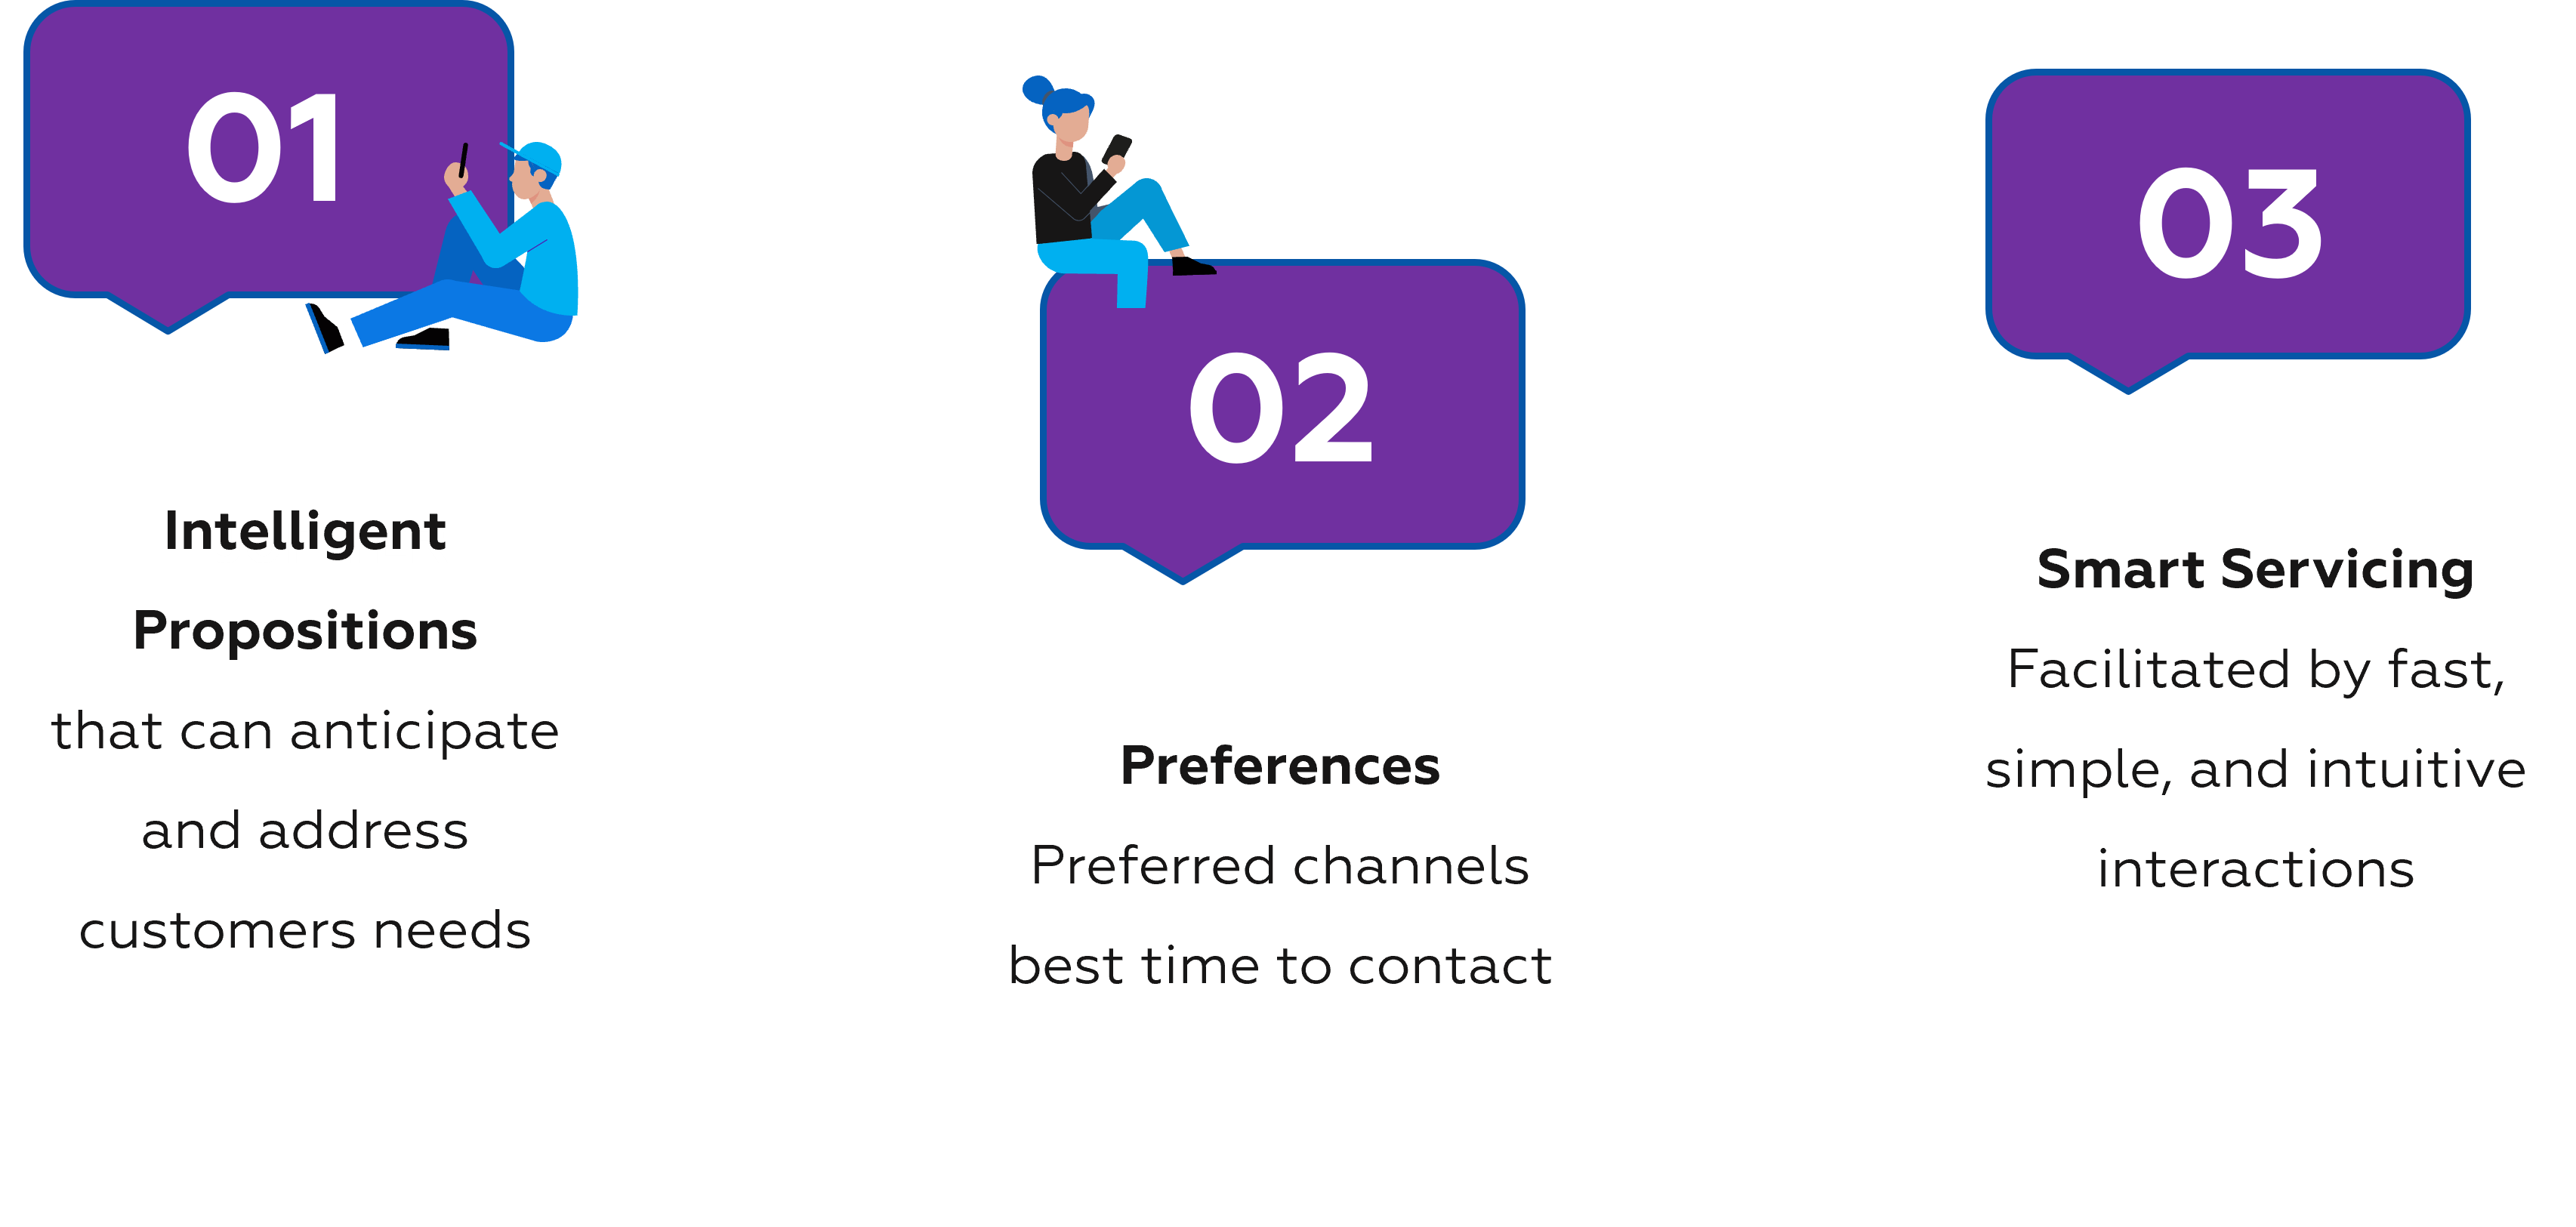
Use Predictive Analytics to Keep Your Customers Well-Stocked, Predictive marketing analytics is a branch of advanced analytics that harnesses all that big data to predict future events or results. Machine-learning algorithms look at customers’ past buying patterns in order to predict their future actions. Using this strategy, you can identify potential threats that may affect their transactions journey and able to easily keep track of their customers’ transaction histories based on the date of transaction.
Give Personalized Recommendations for Individualized Experiences, Personalization is extremely important for customer loyalty. That’s because consumers are more likely to make a transaction if you give them something that they will actually like or are looking for. AI can help you discover exactly what your customers like quickly and easily. And then based on that, you can tailor the content you show them or the products you suggest for them.
Background
The project is focused to optimize the promotion cost-efficiency for customer membership by providing recommendations of which customer group optimal for certain offer types, as well as generate more revenue through customer behavior insights.

Data
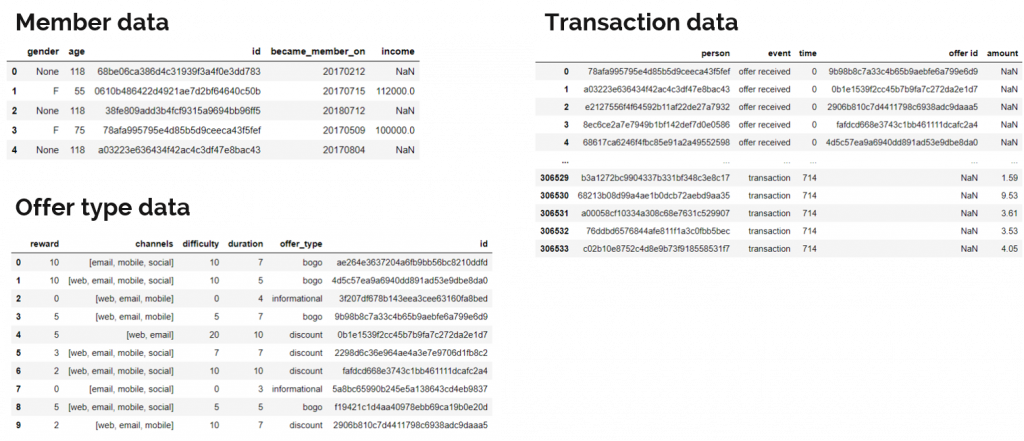
Transaction data includes offers received, viewed, and completed by members as well as the time in hours needed to do the actions
Methods
The data is processed to perform a clustering model which produces customer groups based on their behavior.
Then, these groups can be interpreted in order to achieve targeted marketing and optimize the cost.
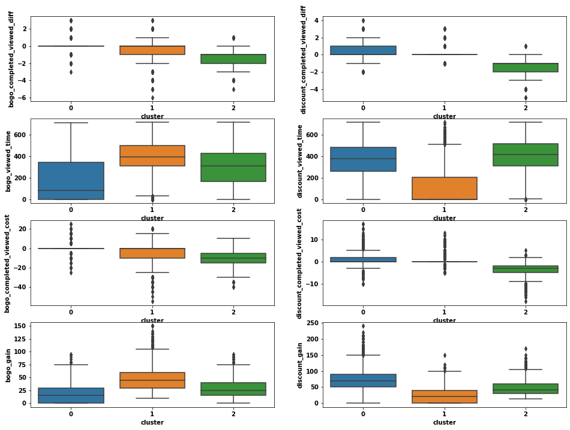
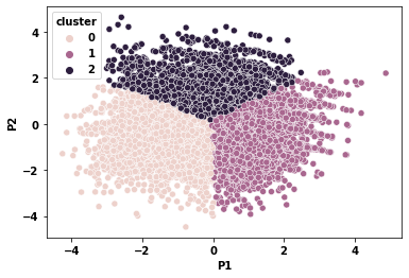
Cluster 0 is not optimal for BOGO offers, while cluster 1 is not optimal for discount offers. Cluster 2 could generate more revenue by providing offers that fit their behavior.
The Results
Before Optimization: Cost-to-Revenue Ratio: 2%
After Optimization: Cost-to-Revenue Ratio: 1.3% (35% more efficient)
Generate up to 16.7% more revenue (from the ‘not interested’ group)
The optimization performance can be improved through more data records and variables, thus, more granular behavior can be captured.
*cost refers to membership promotion cost
Background
“A picture speaks a thousand words” is one of the most commonly used phrases. But the graphics speak more than that. The visual representation of data, in the form of graphs, helps us gain actionable insights and make better data-driven decisions based on that data.
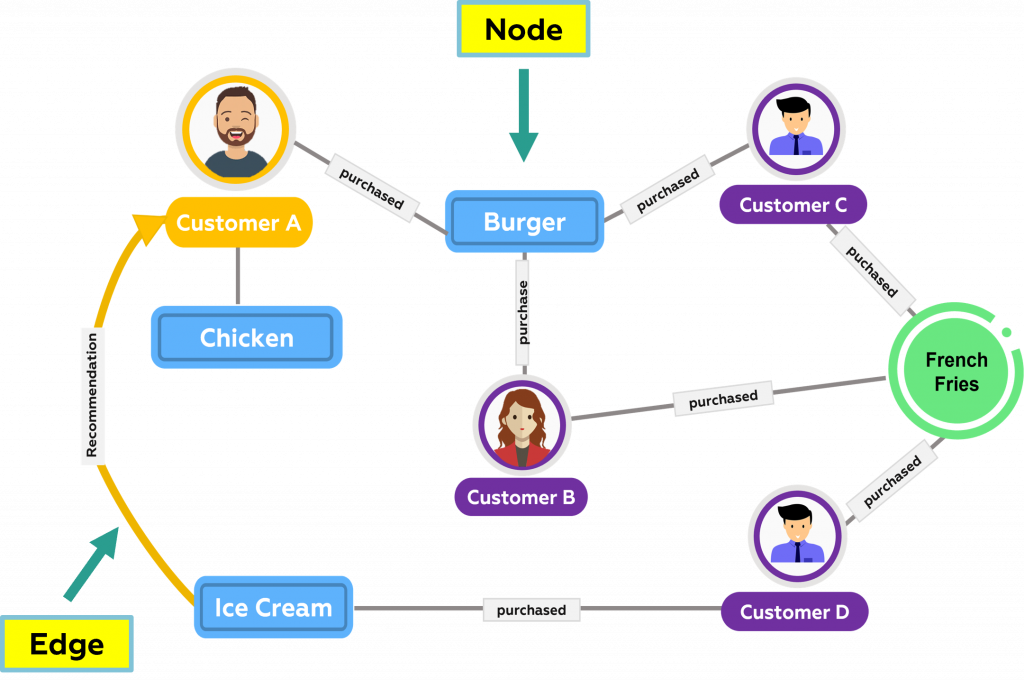
The network consists of 2 elements, nodes, and edges. Nodes represent objects of interest, while edges represent relationships between them. Nodes can be of the same or different categories in the network graph. Thus, the network can show the relationship between people, while at the same time the network can show the connection.
Data
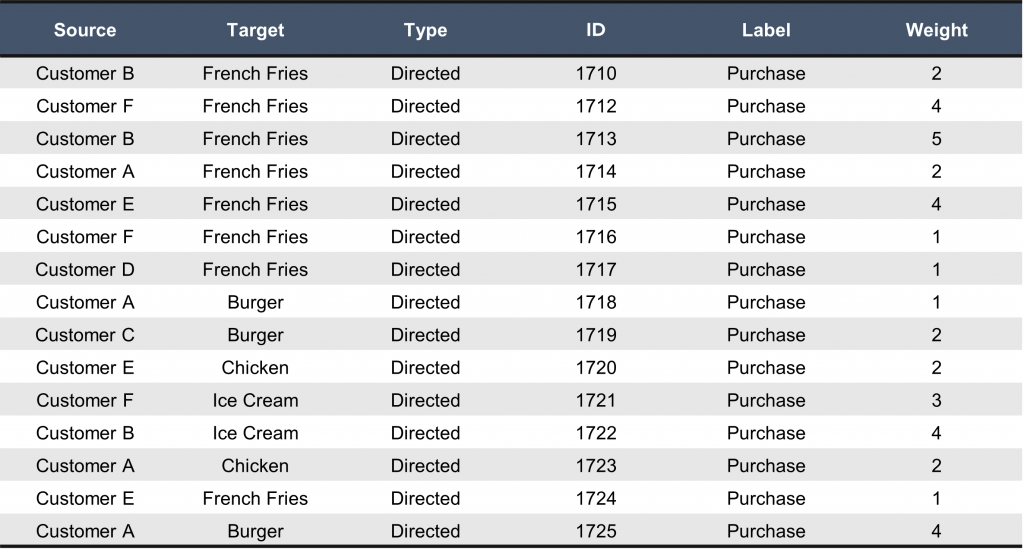
The network is about the connections and relationships between different people, the nodes require (at a minimum) complete ID and Labels columns. The edges require Source, Target, and Weight.
Methods
Based on the mathematics of graph theory, graph algorithms use the relationships between nodes to infer the organization and dynamics of complex systems. Network scientists use these algorithms to uncover hidden information, test hypotheses, and make predictions about behavior.
Nodes
- Can have Labels to classify nodes
- Labels have native indexes
Relationships
- Relate nodes by type and direction
Properties
- Attributes of Nodes & Relationships
- Stored as Name/Value pairs
- Can have indices and composite indexes
Results
Many businesses work with graphs. Some examples are:
- Telecom operators operate fixed or mobile networks which can be modeled as graphs.
- Telecom customers talk to one another and these relationships form graphs.
Why is it important now?
Graph analytics is important due to the expected market growth. According to a recent graph analytics market report, the graph analytics market size was ~$600 million in 2019, and it is expected to reach ~$2.5 billion by 2024, at a Compound Annual Growth Rate (CAGR) of 34% during the forecast period.
Background
Most companies have big data. Big data is a collection of data that is very large in volume but grows exponentially over time. Because you have a lot of data, you most likely don’t always know what’s happening with it and you may not know when your data behaving in a way it shouldn’t. Artificial intelligence (AI) anomaly detection will help your business identify issues around the clock faster and more reliably, increasing efficiency and driving performance.

Data
An automated anomaly detection system uses machine learning to establish the normal patterns of time series metrics. Anomaly detection can detect attacks on a network that deviate from normal activities based on statistical probability. Statistical anomaly detection does not have an intelligent learning model which might cause a false alarm to have a high detection rate.

Methods
Here we will look at detecting anomalies with time series forecasting. Time series is any data related to time (daily, hourly, monthly, etc.). For example, daily store revenue is time-series data at the day level. Many use cases like demand estimation, sales forecasting are common time series forecasting problems that can be solved by algorithms like SARIMA, LSTM, Holtwinters, etc. Time series forecasting helps us prepare for future needs by forecasting them with current data. Once we have an estimate, we can use that data to detect anomalies by comparing them to actual ones.

Results
The challenges for anomaly detection is selecting the appropriate anomaly detection method for each metric, tuning it, and constantly re-evaluating that choice in case the metric itself switched to a new normal behavior and looking for unusual data points by manually examining every metric, however, is impractical for more than a few dozen metrics. – all without human interaction.
An anomaly detection solution must be sophisticated and comprehensive enough to compute not only one outcome, but also tell the entire story and point to the root cause with considerably more benefits and faster time.
Tools Expertise


PT. Indonesia Global Solusindo
APL Tower 18th Floor Unit T7
Jakarta 11470 – Indonesia
Phone: +6221-2950-1189
Email: sales@is-gs.com


